This document looks long. Is there a shorter version?
See here.
What is Voter Satisfaction Efficiency?
Voter Satisfaction Efficiency (VSE) is a way of measuring the outcome quality a voting method will give. It relies on making various assumptions about what kind of voters and candidates are likely to occur, then running large numbers of elections that are simulated using those assumptions, and measuring how satisfied the average simulated voter is by the outcome in each election.
VSE is expressed as a percentage. A voting method which could read voters minds and always pick the candidate that would lead to the highest average happiness would have a VSE of 100%. A method which picked a candidate completely at random would have a VSE of 0%. In theory, VSEs down to negative 100% would be possible if a voting method did worse than a random pick, but in practice, most real-world voting methods — even horrible ones such as plurality voting — can at least beat that mark.
Previously, a similar idea as VSE was known as “Bayesian Regret” or BR. They are related by the following formula: VSE(method)=1-[BR(method) / BR(Random Winner)]
What are the philosophical underpinnings of VSE?
VSE is based on the idea of “utility”, which is what economists call it when they represent each person’s happiness or satisfaction by a single number. The idea is that voting methods are better insofar as they increase overall happiness/satisfaction.
This ethical framework, if taken to its logical conclusion, is called “Utilitarianism”, often summed up by the phrase “the greatest good for the greatest number”. But you do not have to subscribe to full-blown Utilitarianism in order to use VSE. Even if you think that there are some aspects of ethics that cannot be reduced to increasing a one-dimensional measure of overall satisfaction, you’d still probably agree that all else equal, increasing satisfaction is better than decreasing it, and increasing it for many is better than doing so for just a few.
Note that VSE uses the word “satisfaction” rather than “utility” for two reasons. For one thing, it’s just a more everyday word, and so easier to understand. But for another, it’s important to draw a distinction between a voter’s short-term satisfaction with a given election result, and the long-term utility that they actually derive from the candidate’s actions in office. We have no better choice than to trust the voter and assume that the former is a worthwhile measure of the latter; but that does not make them the same thing.
What assumptions are necessary in order to calculate VSE?
Any evaluation of voting methods involves some kind of assumptions. In the case of VSE, the assumptions are necessary in order to generate voters, candidates, and ballots many times over to run virtual elections. To do that, you need to make assumptions about the following:
- The voting method that you will use.
- How voters feel (the “voter model”): An election scenario consists of voters and candidates; each voter has a utility number for each candidate that specifies how satisfied they will be if that candidate wins. The voter model is the set of rules used to randomly generate new election scenarios.
- What voters know (the “media model”): This is the information that’s available to voters as they decide how to cast their ballots.
- How voters act (the “strategy model”): This is how voters combine their feelings of satisfaction for each candidate, with the information they get from the media about which candidates are viable, in order to cast a ballot. Some voters may be more “strategic”, paying more attention to frontrunner status, while others may be more “honest”, paying attention only to their own feelings about the candidates.
Why is VSE a good measure of many aspects of voting method quality?
In the field of voting theory, there are many desirable criteria a given voting method may or may not pass. Basically, most criteria define a certain kind of undesirable outcome, and say that good voting methods should make such outcomes impossible. But it’s been shown mathematically that it’s impossible for a method to pass all desirable criteria (see: Gibbard-Satterthwaite theorem, Arrow’s theorem, etc.), so tradeoffs are necessary. VSE measures how well a method makes those tradeoffs by using outcomes. Basically, instead of asking “can a certain kind of problem ever happen?”, VSE is asking “how rarely do problems of all kinds happen?”.
If the voter model, media model, and strategy model are realistic for a particular context, then VSE is probably a good metric for comparing voting methods. If you find a method which robustly gets a relatively high VSE, across a broad range of voter, media, and strategy models, then you can be confident that it reflects the will of the voters, no matter what that will is. That’s democracy.
What does VSE not measure?
VSE cannot measure:
- The complexity of a voting method (from the perspective of voters or election administrators).
- A voting method’s effects on who decides to run for office in the first place.
- The effects on campaign behavior.
- Any desirable characteristics of a voting method that do not directly relate to outcome (who wins).
What are the various voter models that were used to get the VSE numbers below?
There are three basic models. The first two are simple but unrealistic; the third is more complex but hopefully more realistic.
Note: As a grad student in statistics, building and working with statistical models is my expertise, so I apologize for the inevitable technicalities in what follows. I’ll try to keep things as understandable for a non-expert audience as I can, but it’s always hard to find the right balance. It’s important to be transparent about how things work and why, but I don’t want to overwhelm you with technicalities.
- “Impartial Culture”: Each voter’s satisfaction for each candidate is an independent (normally-distributed) random number.
- “N-dimensional ideology”: Voters and candidates each have a location in n-dimensional “ideology space”. A voter’s satisfaction for a given candidate goes down linearly with the ideological distance between the two. Locations are normally distributed, using the same distribution for candidates and voters; and the standard deviations for each dimension follow an exponentially descending sequence such as 1, 1/2, 1/4, 1/8, etc. The number of dimensions is set so as to be large enough that further dimensions would be insignificant. Thus, the only important parameter is the rate of exponential decay; in the example sequence above, it’s 2.
- “Hierarchical clusters”: This is a complicated model, which combines the following aspects:
- Issue dimensions, much as in n-dimensional ideology.
- However, unlike in n-dimensional ideology these dimensions are grouped into “issue clusters”. Conceptually, one might imagine a cluster of social issues, a cluster of domestic economy issues, a cluster of foreign policy issues, etc.; although of course in the model, these are all merely numbers, and the labels have no impact.
- The dispersion of individuals decreases, both from dimension to dimension within each cluster, and for the largest cluster dimension between clusters. This is similar to the exponential decay of the n-dimensional ideology above, but it is slightly random; the decay factors between each dimension and the next are numbers between 0 and 1, drawn from a beta distribution (which allows adjusting the average value and dispersion).
- Within each issue cluster, voters are organized into “identity clusters” (assigned using the Chinese restaurant process). You might imagine that a certain voter was in a liberal cluster on social issues, a pro-Egypt cluster on foreign policy issues, etc. Another voter might share the same cluster on social issues but be in an isolationist cluster on foreign policy. A given voter’s identity clusters on different issue clusters are independent.
- Each identity cluster has a mean, a standard deviation, and an overall level of caring on the dimensions in that issue cluster.
- Technical: The standard deviation is based on the overall level of caring; higher for clusters that care less, lower for clusters that care more. The means are also chosen from a normal distribution, so that the sum of the squares of the standard deviation used to draw the cluster mean and the standard deviation of the individuals inside that cluster add up to a constant for each dimension; that way, if you don’t know the cluster’s mean, your best guess for where an individual would land on a dimension (the marginal distribution) would always be the same Normal distribution with the standard deviation associated with that dimension.
- Technical: thus, this model has 5 parameters that can be usefully varied:
- The mean of the beta distribution for the decay of standard deviations of dimensions within a cluster.
- The mean of the beta distribution for the decay of standard deviations of dimensions between clusters.
- The “α” (alpha) parameter for all the Chinese restaurant processes, which determines the expected number and size of identity clusters for any given issue cluster. A high α leads to many similarly-sized identity clusters; a low α leads to most voters falling into a few dominant clusters.
- The mean of the beta distribution for how much voters care about each cluster.
- The dispersion (α + β) for all three beta distributions above.
- The 5 parameters above are set to numbers that seem to produce realistic-seeming voter sets, and varied in order to see how robust each method is to different styles of electorate (different amounts of diversity of various kinds).
What are the advantages and disadvantages of each of the voter models used?
- Impartial culture is the simplest, and thus the most widely used in the voting theory literature. It has no adjustable parameters, so using it is like a magician saying “look, there’s nothing up my sleeve.” However, some theorists (such as Michel Regenwetter) have criticised this model as unrealistic, because all the candidates have fundamentally the same quality, so results are often unnaturally close to a tie, and voting methods don’t have a chance to show their strength at ferreting out the underlying superiority of the best candidate.
- N-dimensional ideology is somewhat more realistic than impartial culture, because candidates who are close to the center of the ideology space are stronger than those at the edges. However, it may overcorrect; whereas impartial culture leads to unrealistically many pathological near-tie situations, n-dimensional ideology makes certain tough election scenarios, such as Condorcet cycles, nearly impossible. This means that voting methods that are good at resolving such tough scenarios never get a chance to show their strengths.
- The hierarchical cluster model includes more aspects of reality than the two above, but by the same token it is more complex, and involves more arbitrary parameters. It can have Condorcet cycles for the winner at what seems like a realistic frequency; depending on parameters and the number of candidates, generally around 5%-15%, which is more than in n-D ideology but less than in impartial culture. Thus, the numbers below are based on this model.
What are the strategy models used?
The strategy models include various mixes of the following possibilities:
- Honesty: all voters make their ballots using only their own utility for each candidate, with no reference to any information about the rest of the electorate.
- Strategic: all voters are strategic. In many voting methods, this involves finding the two frontrunners, and giving the maximum possible vote to one and the minimum possible vote to the other.
- One-sided strategy: the voters who support the top frontrunner vote honestly, but those who support the runner-up vote strategically. This is unlikely to actually happen in practice, because the frontrunner supporters would probably strategically retaliate if they saw the runner-up supporters organizing for strategic voting. But pure one-sided strategy is still an important possibility to look at, because the more the runner-up supporters think that they have any chance of winning through one-sided strategy, the more likely they are to attempt it.
Where’s the code?
The Center for Election Science’s GitHub
What voting methods do you test?
- Plurality voting. This is one of the worst voting methods, but also the most commonly-used, especially in English-speaking countries.
- Majority Approval Voting (MAV): A median-based / Bucklin method.
- Majority Judgment (MJ): Another median-based / quasi-Bucklin method.
- IRV/RCV: Instant Runoff Voting / Ranked Choice Voting - A ranked method; used in a significant number of political jurisdictions. Also called “the alternative vote”.
- Schulze: a Condorcet method.
- Rp (Ranked Pairs): a Condorcet method.
- Approval voting: Voters approve as many candidates as they like, and the most-approved wins. In my graphs, this is split into two methods:
- IdealApproval: Approval voting, where the “honest” (baseline) vote is to approve any candidate with above-average utility. (It turns out that with this model for candidate utilities, this strategy isn’t actually ideal…)
- BulletyApproval60: Approval voting, where the “honest” baseline is that 60% of voters bullet vote (approve only their favorite candidate), and 40% vote as in IdealApproval.
- Score voting: Voters give candidates a numerical rating, and the highest total or average rating wins.
- STAR Voting (Score then Automatic runoff): Voters cast ballots as in score voting, rating each candidate on a numerical scale. The two candidates with the highest total or average are selected, and the pairwise winner between those two is the overall winner.
- 3-2-1 Voting (V321): Voters may rate each candidate “Good”, “Acceptable”, or “Rejected”. You find the winner in three steps.
- Find 3 Semifinalists: the candidates with the most “good” ratings.
- Find 2 Finalists: the semifinalists with the fewest rejections.
- Find 1 winner: the finalist who is rated above the other on more ballots.
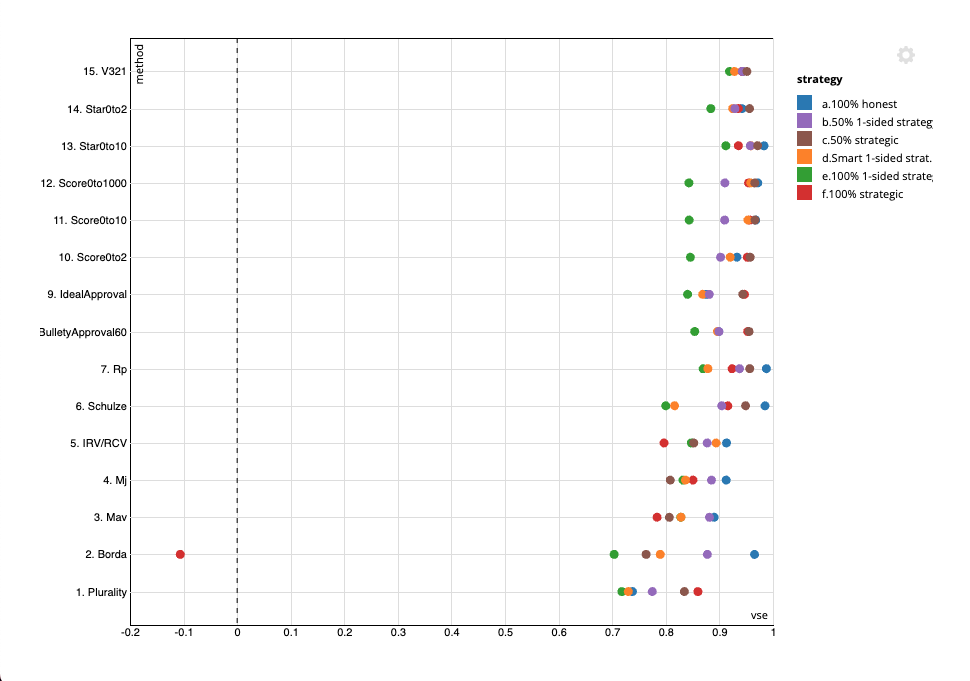
OK, can I see some results?
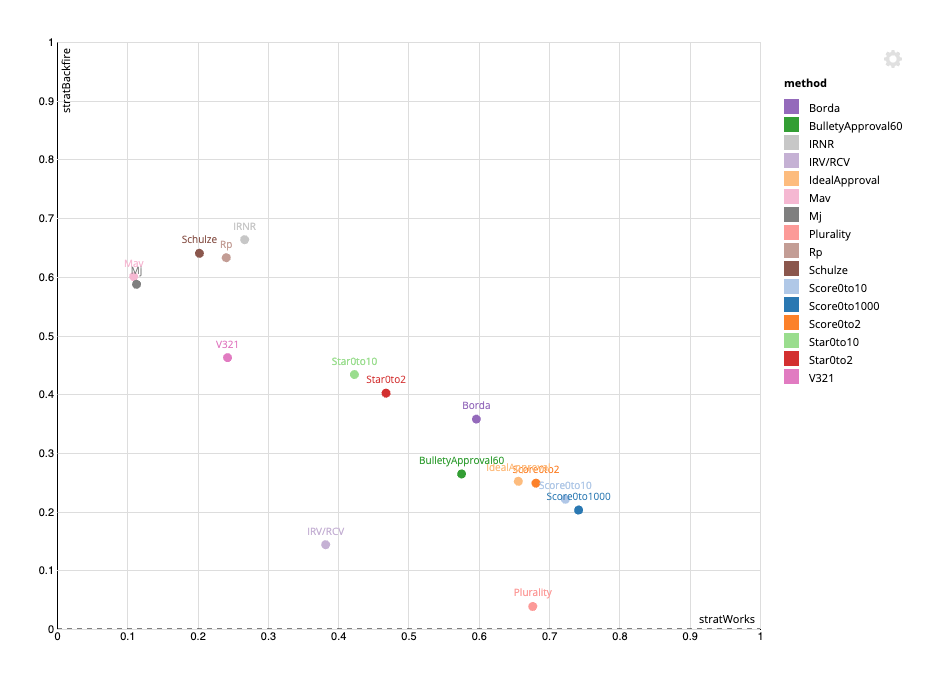
Click to go to interactive versions of the following graphs:
Or, broken down by scenario type:
VSE Effectiveness of strategies
Those results are broken down by “Scenario type”. Why?
Classifying each simulated election into one of several “scenario types” makes it less important to get the precise voter model correct. Depending on the voter model used and on the parameters of that voter model, different types of scenarios will be more or less common. However, if you define “scenario types” with an eye to grouping elections with similar strategic considerations, the results for a given voting method within a given scenario type will be less dependent on the voter model details than the overall results are across types. The overall results will basically be a weighted average of the results by scenario type, and adjusting the voter model will mostly change the weights only, not the results within a type.
Could you explain the 6 scenario types you use?
The “type classifier” tries to fit each scenario into 5 types in order, labeling it with the first type that it fits. If it fits none of the 5 types, it’s labeled “other”.
The types are:
- “Condorcet cycle”: elections where there is an honest Condorcet cycle for first place. These are often the hardest elections to find a good winner for. This is about 2% of elections in the voter model I used.
- “Easy”: Elections where the honest Condorcet winner is also the honest Plurality winner (and which don’t fit the above category). Any reasonable election method should have an easy time finding the “correct” winner in such elections. This is almost 50% of elections in the voter model I used.
- “Spoiler”: Elections which don’t fit either of the above, but where the honest Condorcet winner would be the honest winner in a plurality runoff among the top 3 candidates by a Condorcet method. Most voting method other than plurality can usually do well in these scenarios. This is about 9% of elections in the voter model I used.
- “Center squeeze”: Elections where the honest Condorcet winner would come 3rd in said runoff. These scenarios are a problem for IRV/RCV, but are not handled too badly by most other methods. This is about 9% of elections in the voter model I used.
- “Chicken dilemma”: Elections which are not “Center Squeeze”, but where the honest winner of said runoff would be 3rd place in Condorcet. In many methods these elections may be particularly problematic in real life, where voters’ strategy can react to their expectations of others’ strategy; but in simulated elections, this effect is moderated by the fact that voters are arbitrarily set to be strategic or not. This is about 7% of elections in the voter model I used.
- “Other”: Elections which fit none of the categories above. This is about 25% of elections in the voter model I used.
Can you summarize the outcomes?
See here.